The dashboard
Triggering the dashboard charts
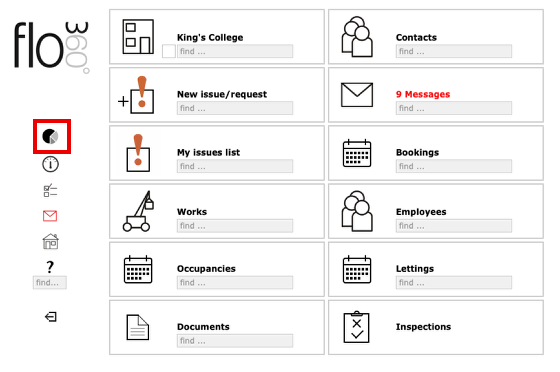
The dashboard button shows on the start screen and on resources records (ie the site record, section record, asset record etc).
Triggering the dashboard for a specific resource level
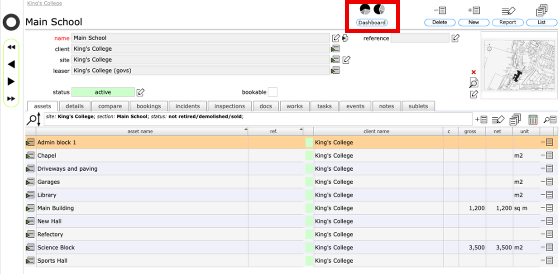
You can restrict the dashboard charts data to the current resource level by triggering the dashboard from the relevant resource record. In this case, clicking the button on the Main School record will restrict the dashboard charts to data relevant to Main School only.
The charts are available at all resource levels, right down to individual components.
Dashboard charts
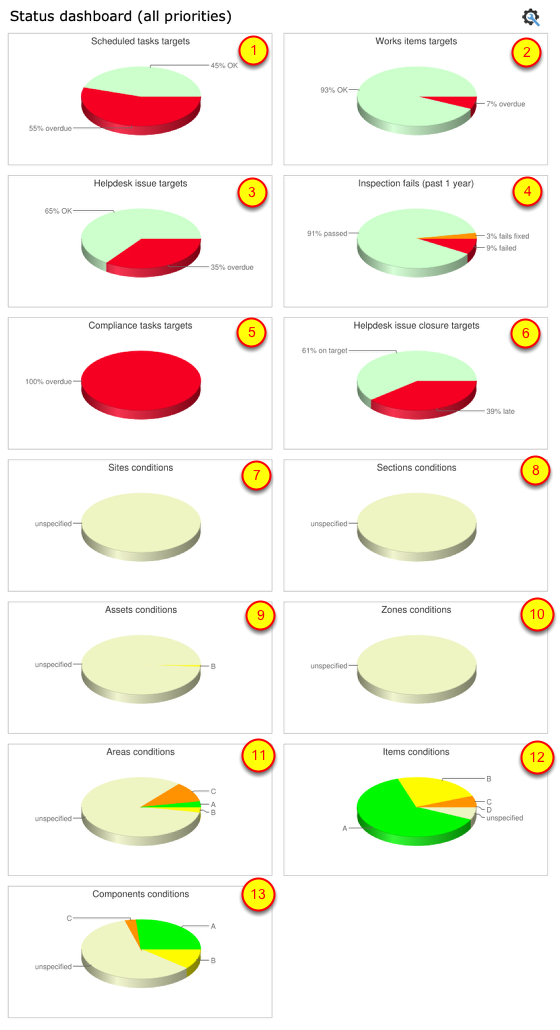
The dashboard can show some or all of these charts (charts will only be shown if there is relevant data available for the current user):
- Scheduled tasks targets - percentage still on track and those running overdue (past due date)
- Works items targets - percentage still on track and those running overdue (past requested completion / target date)
- Helpdesk issue targets - percentage still on track and those running overdue (past target date). Only those issues with specified target dates are included.
- Inspection fails - percentage of inspections with no fail points and those with fail points
- Compliance tasks targets - percentage of scheduled tasks with compliance constraints still on track and those running overdue (past due date). Only tasks with a specific compliance constraints are included.
- Helpdesk issue closure targets - percentage of helpdesk issues with targets closed on target and those where the target was missed. Only those issues with specified target dates are included.
- Sites level current conditions - reports on the current recorded condition of sites records (as set on the details tab of the site record)
- Sections level current conditions - reports on the current recorded condition of sections records (as set on the details tab of the section record)
- Assets level current conditions - reports on the current recorded condition of assets records (as set on the details tab of the asset record)
- Zones level current conditions - reports on the current recorded condition of zones records (as set on the details tab of the zone record)
- Areas level current conditions - reports on the current recorded condition of areas records (as set on the details tab of the area record)
- Items level current conditions - reports on the current recorded condition of items records (as set on the details tab of the item record)
- Component level current conditions - reports on the current recorded condition of components records (as set on the details tab of the component record)
Click on any charts 1-6 to see the list of records relating to the red section (ie the overdue / failed records)
Setting the priority levels to include in dashboard charts data
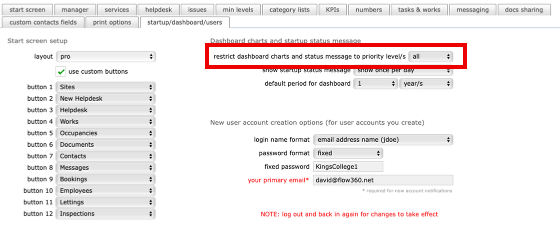
You can specify which priority levels to include in the dashboard charts in your personal preferences on the startup/dashboard/users tab. Change this setting whenever you require and the charts will use that level for data the next time you trigger them.
Set the time period to use for historcal data
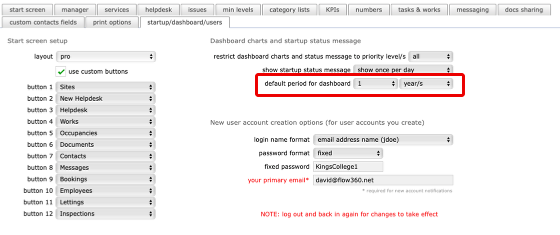
Set the default time interval to use for charts that are based on historical data rather than all active records (for example, Inspections fails charts). If you wish to include only those inspections from the past year for example, set this option to 1 Year.
Customise the range of charts displayed
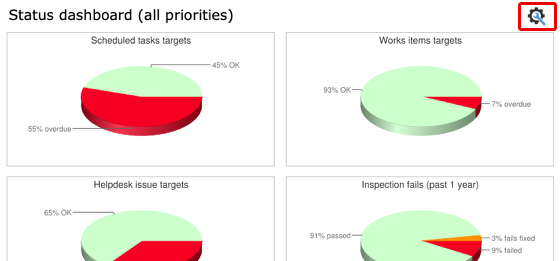
Click the customise tool button to change or reset the range of charts displayed (this setting will be remembered for future sessions and can be changed whenever required).
Chart selection
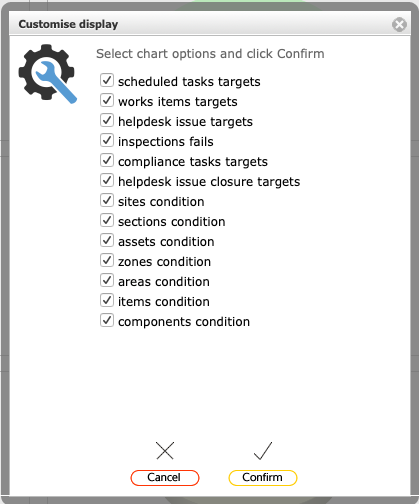
Select the charts that you wish to have included and click the Confirm button to save.