Checking resource usage statistics
How to check on resource usage statistics
The resource record
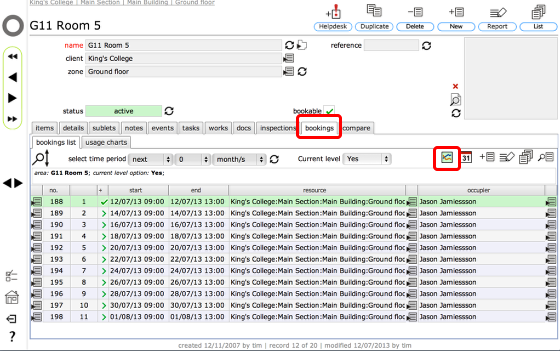
On the relevant resource record, start by selecting the bookings tab.
Click the usage chart button.
Set chart options
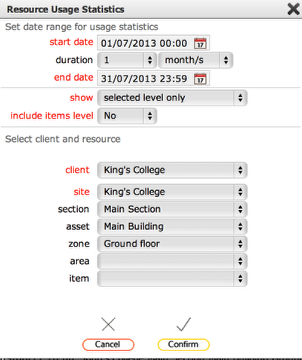
In the dialogue, enter the date range you want charted and click Confirm
Usage charts
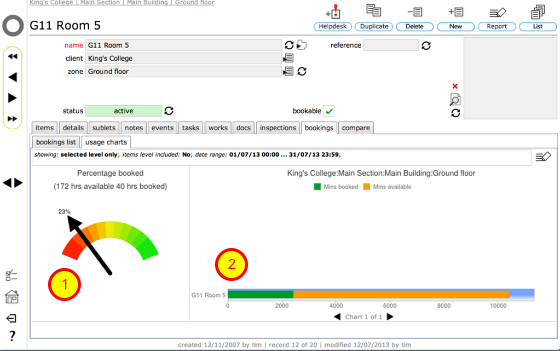
The swingometer chart (1) indicates actual bookings as a percentage of the total bookable time available for the selected resource.
The bar chart (2) shows actual minutes booked against bookable minutes.
Usage charts for multiple resources
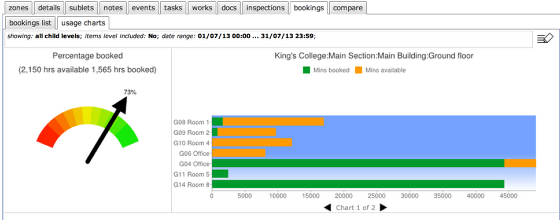
If you run the same process at zone (i.e. floor) or asset (i.e. building) levels and selecting relevant child levels in the chart setup dialogue you can generate cumulative totals for all bookable resources contained within that zone or asset along with individual bar charts for each bookable resource.