Helpdesk Issue KPIs and Charts
Key performance indicators for Helpdesk issues
The Helpdesk Issues List
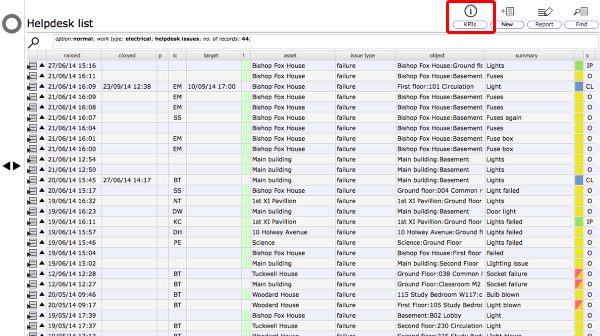
To get a KPI report or just some comparison figures, click the KPIs button at the top of the Helpdesk issues list.
Single date vs Compare dates
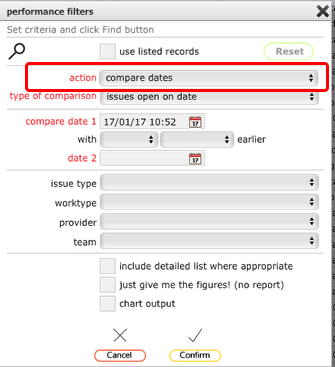
Some outputs allow you to compare one date or period with another. To do this make sure that you set the action option to compare dates.
For all outputs you can also choose to view outputs just for a single date by setting the action option to single date.
NOTE: For some chart outputs the compare dates option is not appropriate and cannot be set. In these cases the action option will automatically be set to single date and cannot be changed.
Types of comparison
There are currently 14 main types of comparison/output you can choose from on the type of comparison option. These are outlined below:
- issues open on date - with compare dates option: outputs the number of issues on date 1 compared with the number of issues open on date 2 and gets the difference as a percentage increase/decrease; with single date option: outputs the issues open on that date;
- issues open for more than 7 days on date - with compare dates option: outputs the number of issues on that were open for more than 7 days on date 1 compared with the number of issues that were open for more than 7 days on date 2 and gets the difference as a percentage increase/decrease; with single date option: outputs the issues that were open for more than 7 days on that date;
- issues open for more than 30 days on date - with compare dates option: outputs the number of issues on that were open for more than 30 days on date 1 compared with the number of issues that were open for more than 30 days on date 2 and gets the difference as a percentage increase/decrease; with single date option: outputs the issues that were open for more than 30 days on that date;
- issues logged per day in period (single date ONLY, chart output ONLY, max period of 4 weeks) - charts the number of issues logged per day during the selected period;
- issues logged per week in period (single date ONLY, chart output ONLY, max period of 5 months) - charts the number of issues logged per week during the selected period;
- issues logged per month in period (single date ONLY, chart output ONLY, max period of 2 years) - charts the number of issues logged per month during the selected period;
- issues logged vs issues closed per day in period (single date ONLY, chart output ONLY, max period of 4 weeks) - charts the number of issues logged per day vs the number of issues closed per day during the selected period;
- issues logged vs issues closed per week in period (single date ONLY, chart output ONLY, max period of 5 months) - charts the number of issues logged per week vs the number of issues closed per week during the selected period;
- issues logged vs issues closed per month in period (single date ONLY, chart output ONLY, max period of 2 years) - charts the number of issues logged per month vs the number of issues closed per month during the selected period;
- issues closed during period vs average for period (single date ONLY) - compares the number of issues closed during a specific period with the average number of issues closed during past periods of the same duration and gets the change as a percentage increase/decrease (i.e. compare the past 2 weeks with an average for all 2 week periods);
- % isssues closed on target during period vs average for period - compares the percentage of issues with targets that were closed on or ahead of target during a specific period with the average percentage of issues with targets that were closed on or ahead of target during past periods of the same duration (from the range start in date 2) and gets the change as a percentage increase/decrease.
- average closure time for issues in period by priority (single date ONLY, chart output ONLY) - charts the average closure time (in hours) by priority level for issues closed during the specified period and also lists the relevant total number of issues per priority level at the end;
- average closure time for issues in period by CIPFA priority (single date ONLY, chart output ONLY)- charts the average closure time (in hours) by CIPFA priority level for issues closed during the specified period and also lists the relevant total number of issues per CIPFA priority level at the end;
'Issues open on date' example
- Set the action option to compare dates
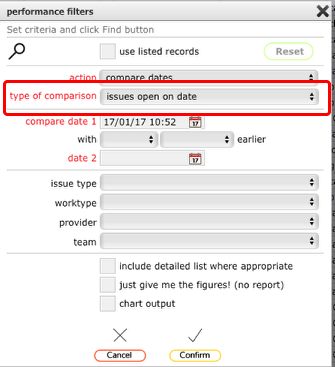
- Set the type of comparison to issues open on date
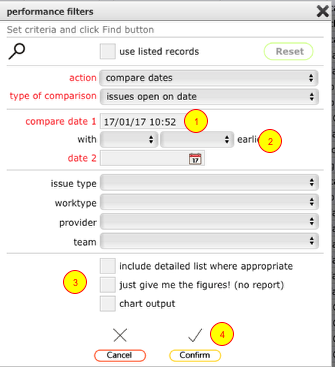
- Set date 1 (the most recent date) to the current date or earlier
- Use the selectors to set the time period to calculate date 2 (the earlier date) or simply set date 2 manually
- Set the relevant options for required output (detailed listing, headline figures only or chart output)
- Click the Confirm button to create the report
'Issues open on date' detailed list
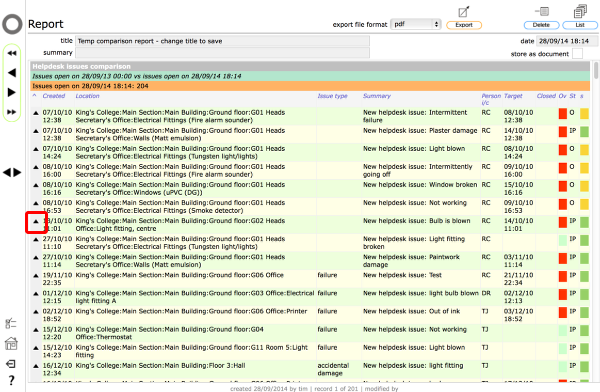
If you opt for the 'include detailed list where appropriate' option you will see a report output listing both the issues on date 1 and the issues open on date 2. At the end of the report you will see the summary of the number of issues open on each date and the percentage change between date 2 and date 1.
You can trigger a popup dialog with outline information on an issue by clciking the 'show popup' button on the relevant row in the report. You can also drill through to the full issue record from the popup dialog if you need more complete information.
'Issues open on date' headlines report option
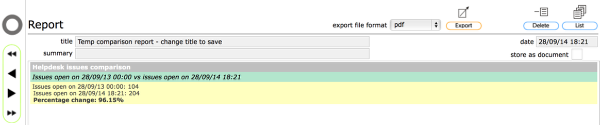
If you do not opt for the 'include detailed list where appropriate' option you will see a simple report output just giving the totals for each of date 1 and date 2 plus the percentage change.
'Issues open on date' just give me the figures option
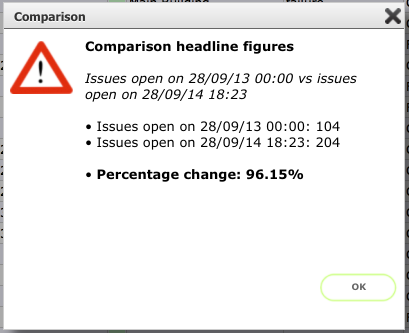
If you select the 'just give me the figures' option you will see a popup dialog with the headline figures and the percentage change. No report output will be triggered.
'Issues open for more than 30 days' example
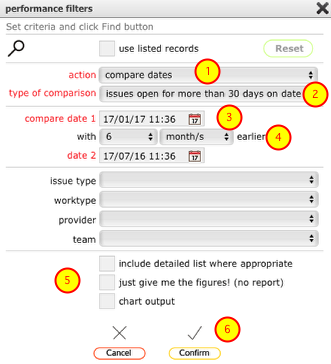
1. Set the action option to compare dates (single date option is also available)
2. Set the type of comparison to issues open for more than 30 days on date
3. Set date 1 (the most recent date) to the current date or earlier
4. Use the selectors to set the time period to calculate date 2 (the earlier date) or simply set date 2 manually
5. Set the relevant options for required output (detailed listing, headline figures only or chart output)
6. Click the Confirm button to create the report
The output will compare the number of issues that were open for more than 30 days on date 1 with the number of issues that were open for more than 30 days on date 2 and calculate the percentage change from date 2 to date 1.
'Issues closed during period vs average for period' example
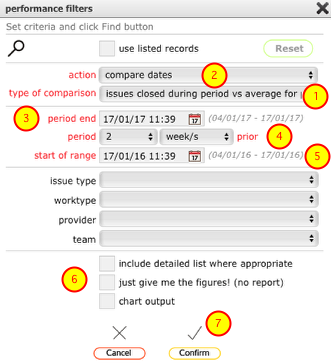
- Set the type of comparison to issues open for more than 30 days on date
- The action option is auto-set to compare dates
- Set the period end date to the current date or earlier
- Use the selectors to set the time period (ending on the period end date) to use as the basis for the comparison
- Confirm the start date for the comparison range (for example if you want to compare the current 2 week period with the average for all 2 week periods starting from Jan 1st, set this date to Jan 1st)
- Set the relevant options for required output
- Click the Confirm button to create the report
The output will compare the number of issues closed during the specified length of period (i.e. 2 weeks) ending on the period end date with the average number of issues closed during all periods of the same length (i.e. 2 weeks) from the specified start of range up to the start of the current period. The percentage change between the average number of issues closed in all periods from the start of range date with the number of issues closed during the period ending on the period end date will also be calculated and displayed.
'% issues closed on target during period vs average for period' example
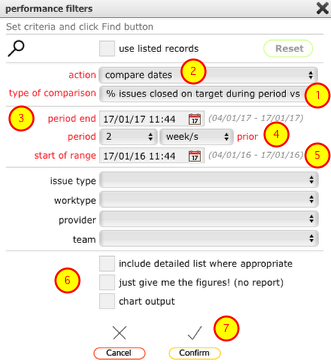
- Set the type of comparison to issues open for more than 30 days on date
- The action option is auto-set to compare dates
- Set the period end date to the current date or earlier
- Use the selectors to set the time period (ending on the period end date) to use as the basis for the comparison
- Confirm the start date for the comparison range (for example if you want to compare the current 2 week period with the average for all 2 week periods starting from Jan 1st, set this date to Jan 1st)
- Set the relevant options for required output
- Click the Confirm button to create the report
The output will compare the percentage of issues with targets that were closed on or ahead of target during the specified length of period (i.e. 2 weeks) ending on the period end date with the percentage of issues with targets closed on or ahead of target during all periods of the same length (i.e. 2 weeks) from the specified start of range up to the start of the current period. The percentage change between the average percentage of issues closed in all periods from the start of range date with the percentage of issues closed during the period ending on the period end date will also be calculated and displayed.
Chart output example for 'issues logged vs issues closed per month in period'
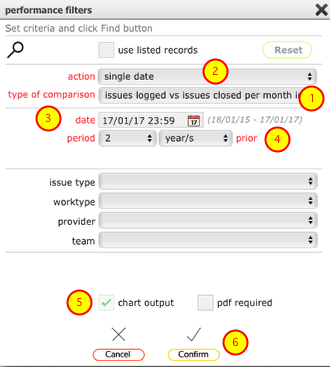
- Set the type of comparison to issues logged vs issues closed per month in period
- The action option is auto-set to compare dates
- Set date 1 (the most recent date) to the current date or earlier
- Use the selectors to set the time period required
- Output option is auto-set to chart output. If you need pdf output from this chart also set the pdf required tickbox.
- Click the Confirm button to create the report
NOTES:
- Only single date is possible for this selection
- Only chart ouput is possible for this selection
Chart output example for 'issues logged vs issues closed per month in period'
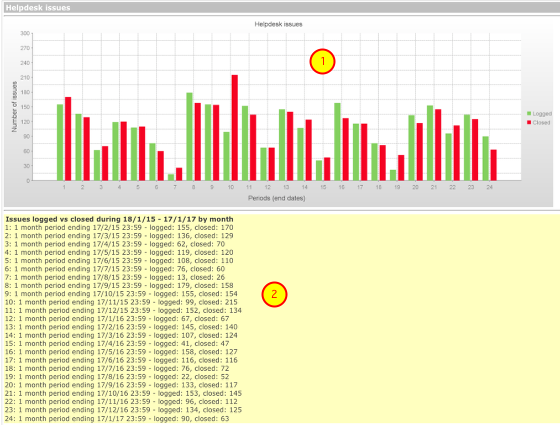
- The chart shows the number of issues logged (green bars) and the number of issues closed (red bars) for each month in the requested period (in this case 2 years).
- The details at the end confirm the date ranges for each period and the actual numbers