Works KPIs
Key performance indicators for works orders
The works list
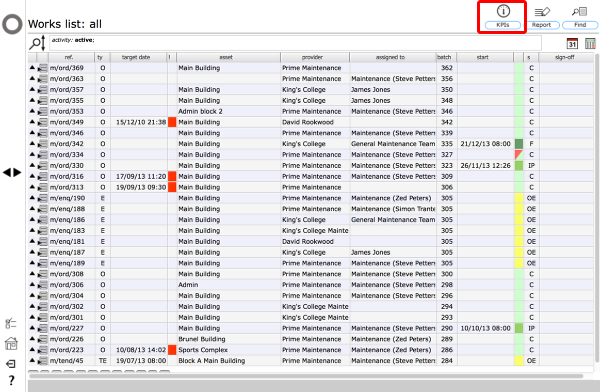
To get a KPI report or just some comparison figures, click the KPIs button at the top of the works list.
KPI options
There are 4 basic KPI report options:
- works orders open on date - compares the number of orders open on date 1 with the number of orders open on date 2 and gets the difference as a percentage increase/decrease;
- works orders open for more than 30 days - compares the number of orders open for more than 30 days on date 1 with the number of orders open for more than 30 days on date 2 and gets the difference as a percentage increase/decrease;
- works orders completed during period vs average for period - compares the number of orders completed during a specific period with the average number of orders completed during past periods of the same duration and gets the change as a percentage increase/decrease (i.e. compare the past 2 weeks with an average for all 2 week periods);
- % works orders completed on target during period vs average for period - compares the percentage of orders with targets that were completed on or ahead of target during a specific period with the average percentage of orders with targets that were completed on or ahead of target during past periods of the same duration and gets the change as a percentage increase/decrease.
'Issues open on date' example
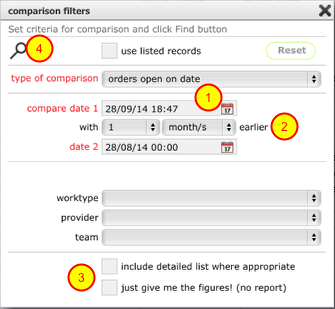
- Set date 1 (the most recent date) to the current date or earlier
- Use the selectors to set the time period to calculate date 2 (the earlier date) or simply set date 2 manually
- Set the relevant options for required output
- Click the Find button to create the report
'Orders open on date' detailed list
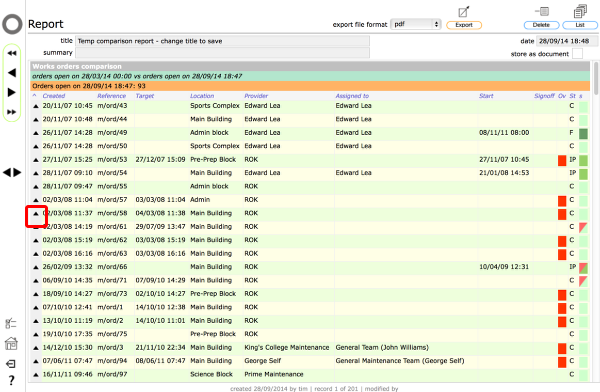
If you opt for the 'include detailed list where appropriate' option you will see a report output listing both the orders on date 1 and the orders open on date 2. At the end of the report you will see the summary of the number of orders open on each date and the percentage change between date 2 and date 1.
You can trigger a popup dialog with outline information on an order by clicking the 'show popup' button on the relevant row in the report. You can also drill through to the full order record from the popup dialog if you need more complete information.
'Orders open on date' headlines report option
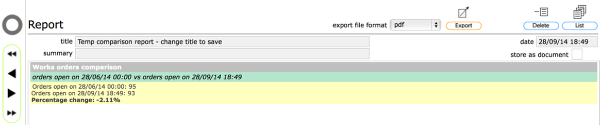
If you do not opt for the 'include detailed list where appropriate' option you will see a simple report output just giving the totals for each of date 1 and date 2 plus the percentage change.
'Orders open on date' just give me the figures option
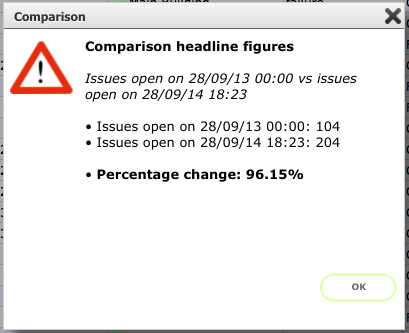
If you select the 'just give me the figures' option you will see a popup dialog with the headline figures and the percentage change. No report output will be triggered.
'Orders open for more than 30 days' example
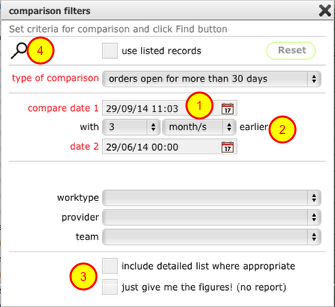
- Set date 1 (the most recent date) to the current date or earlier
- Use the selectors to set the time period to calculate date 2 (the earlier date) or simply set date 2 manually
- Set the relevant options for required output
- Click the Find button to create the report
The output will compare the number of orders that were open for more than 30 days on date 1 with the number of orders that were open for more than 30 days on date 2 and calculate the percentage change from date 2 to date 1.
'Orders completed during period vs average for period' example
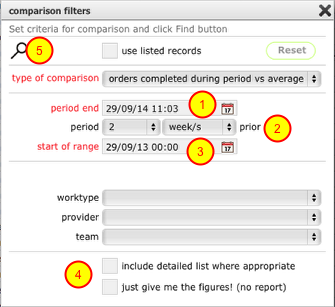
- Set the period end date to the current date or earlier
- Use the selectors to set the time period (ending on the period end date) to use as the basis for the comparison
- Confirm the start date for the comparison range (for example if you want to compare the current 2 week period with the average for all 2 week periods starting from Jan 1st, set this date to Jan 1st)
- Set the relevant options for required output
- Click the Find button to create the report
The output will compare the number of orders completed during the specified length of period (i.e. 2 weeks) ending on the period end date with the average number of orders completed during all periods of the same length (i.e. 2 weeks) from the specified start of range up to the start of the current period. The percentage change between the average number of orders completed in all periods from the start of range date with the number of orders completed during the period ending on the period end date will also be calculated and displayed.
'% orders completed on target during period vs average for period' example
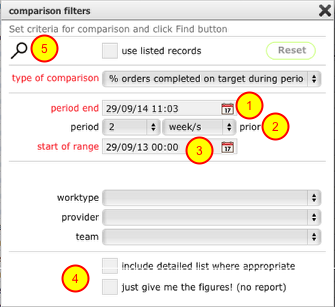
- Set the period end date to the current date or earlier
- Use the selectors to set the time period (ending on the period end date) to use as the basis for the comparison
- Confirm the start date for the comparison range (for example if you want to compare the current 2 week period with the average for all 2 week periods starting from Jan 1st, set this date to Jan 1st)
- Set the relevant options for required output
- Click the Find button to create the report
The output will compare the percentage of orders with targets that were completed on or ahead of target during the specified length of period (i.e. 2 weeks) ending on the period end date with the percentage of orders with targets completed on or ahead of target during all periods of the same length (i.e. 2 weeks) from the specified start of range up to the start of the current period. The percentage change between the average percentage of orders completed in all periods from the start of range date with the percentage of orders completed during the period ending on the period end date will also be calculated and displayed.